Bitcoin (BTC) eases slightly on Monday, trading at around $68,400, after a 9.8% rally last week which was bolstered by a $2.13 billion inflow into the US spot Exchange Traded Funds (ETFs).
On-chain data further supports a bullish outlook as Bitcoin’s open interest has reached an all-time high (ATH) of over $40 billion and amid an increase in whale wallets. At the same time, reports suggest that the SEC’s approval of Bitcoin ETF options on the NYSE could enhance liquidity and attract sustainable inflows, supporting the “Uptober” narrative.
Bitcoin institutional demand surges
Institutional flow supported the rise of Bitcoin prices last week. According to the Coinglass ETF data, the US Spot ETF recorded an inflow of $2.13 billion, primarily driven by BlackRock (IBIT) funds, which accounted for $1.14 billion. If this magnitude of inflows persists or further increases, it could further contribute to the recent Bitcoin price rally.

Total Bitcoin Spot ETF Net Inflow chart. Source: Coinglass
Bitcoin Futures Open Interest (USD) data from Coinglass shows that it reached a new all-time high (ATH) of $40.66 billion on Monday, indicating an influx of new buying in the market.

BTC Futures Open Interest Chart. Source: Coinglass
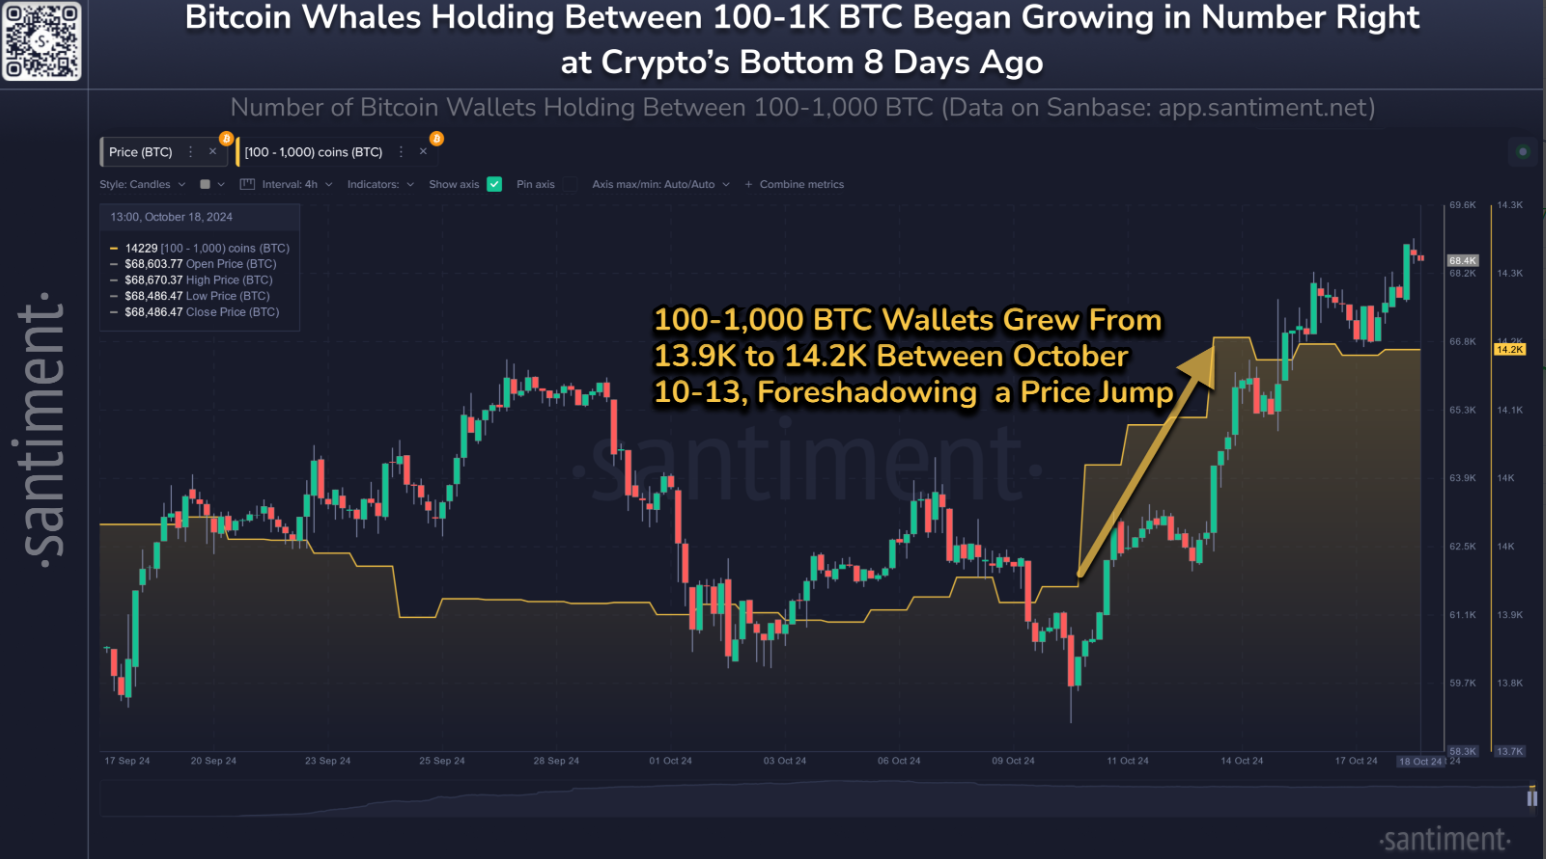
This influx of capital is further aligned with the whale-holding data from Santiment. Between October 10 and October 14, the number of Bitcoin whales holding between 100 to 1,000 BTC increased from 13,900 to 14,200, a gain of 300 wallets that likely contributed to the ongoing bull rally.

Bitcoin whale holdings chart. Source: Santiment
QCP Capital’s (crypto asset trading firm) weekly report on Saturday also highlights optimism for Bitcoin’s price.
“The consistent inflows into the ETF highlight that institutional demand remains strong. With this morning’s approval by the SEC’s approval for BTC ETF options to be listed on the NYSE, we believe this will provide the ETF with the needed liquidity to attract sustainable inflows,” says the report.
“With US equities close to all-time highs and the Japanese yen on a fresh weakening trend, risk-on sentiment will only grow stronger as we approach the US election. This will propel risk assets higher and support our Uptober narrative,” the report adds.
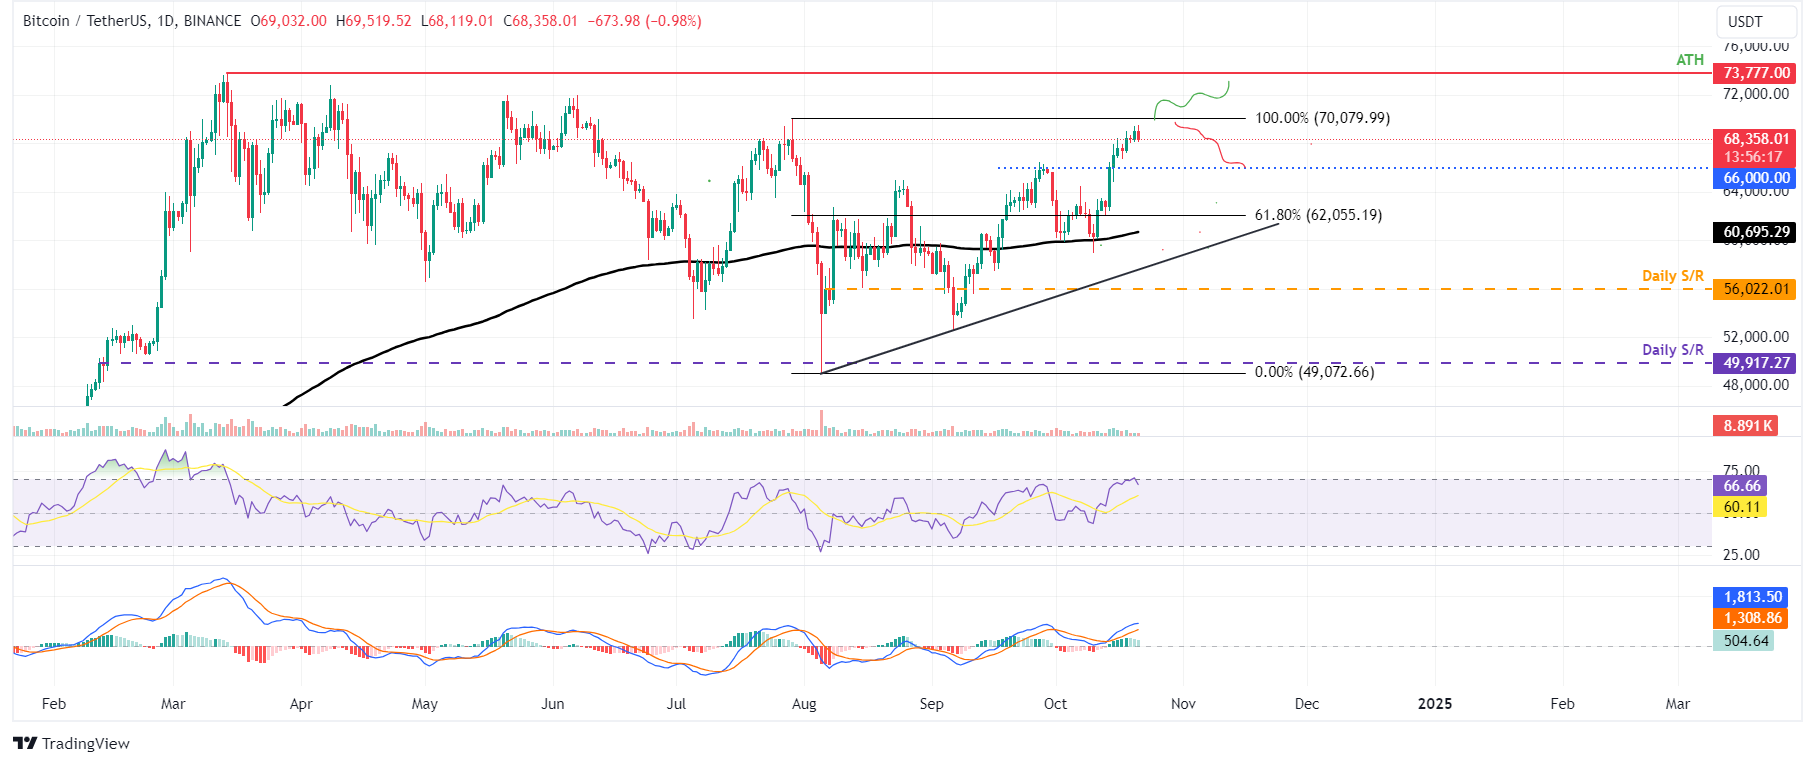
Bitcoin Price Forecast: Will BTC reach its all-time high of $73,777?
Bitcoin faces resistance around its July 29 high of $70,079 after breaking above the psychological level of $66,000 on October 15 and rising 2.7%.
If BTC breaks and closes above $70,079, its next key barrier is already the all-time high of $73,777 seen in mid-March.
The Relative Strength Index (RSI) indicator on the daily chart trades at 66, pointing slightly downwards from its overbought level of 70, indicating a weakness in momentum. However, if the RSI bounces back and rises, the rally will continue. But if it continues to decline and closes below its neutral level of 50, it could lead to a sharp decline in Bitcoin price.

BTC/USDT daily chart
If BTC fails to break above the $70,079 level, it could decline and find support around the psychologically important $66,000 level.
