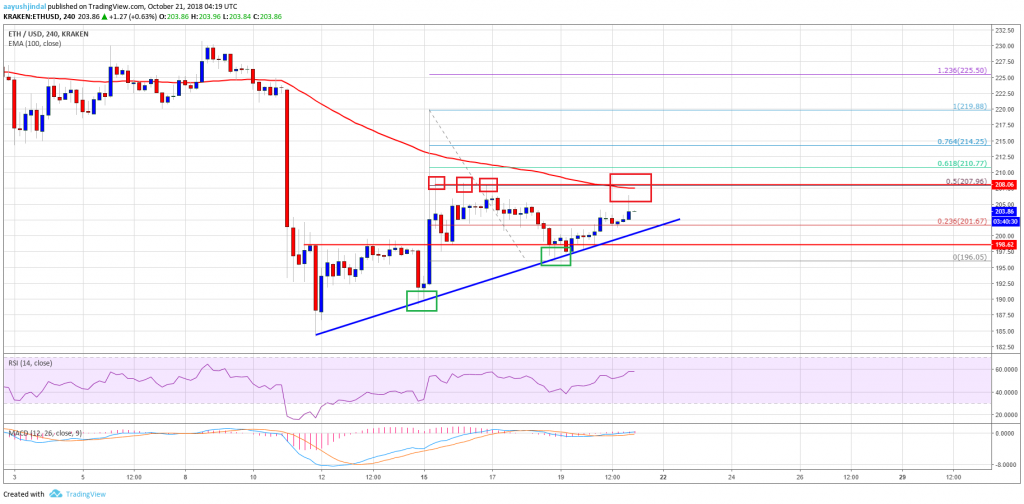
ETH price declined recently below the $200 level before buyers emerged near $196 against the US Dollar.
There is a major bullish trend line with support at $201 on the 4-hours chart of ETH/USD (data feed via Kraken).
The pair must clear the $207 hurdle and the 100 simple moving average (4-hours) to gain momentum.
Ethereum price is trading near crucial levels versus the US Dollar and Bitcoin. ETH/USD must surpass the $207 and $214 levels to gain upside momentum.
Ethereum Price Analysis
This past week, there was a slow and steady decline below the $215 level in ETH price against the US Dollar. The ETH/USD pair even traded below the $200 support and settled below the 100 simple moving average (4-hours). The price traded as low as $196 and later started an upside correction. It traded above the $200 level and recovered more than 2%.
During the climb, it broke the 23.6% Fib retracement level of the recent decline from the $219 high to $196 low. However, there is a strong resistance formed near $207 and the 100 simple moving average (4-hours). There were a couple of rejections near $207-208 and it may continue to prevent gains. It also represents the 50% Fib retracement level of the recent decline from the $219 high to $196 low. Therefore, a successful close above the $207 level and the 100 simple moving average (4-hours) is needed for more gains in the near term.
The above chart indicates that ETH price is trading near crucial levels with support near $201. There is also a major bullish trend line with support at $201 on the same chart. Therefore, the price may soon make the next move either above $207-208 or below $201. Above $208, the price is likely to test the next key resistance at $214.
4-hours MACD – The MACD is slightly placed in the bullish zone.
4-hours RSI – The RSI is currently near the 55 level.
Major Support Level – $201
Major Resistance Level – $207
